Monitoring
Axon.ivy uses a library called Log4j from Apache Foundation to log certain events. The logging configuration file is located in the {Axon.ivy Install Directory}/configuration directory and is called log4jconfig.xml. By default log events are written to the console and to log files. The log files are written to the {Axon.ivy Install Directory}/logs directory.
| Logging type | Log level |
|---|---|
| Console log | WARN |
| File log | INFO |
| Windows Event Log | FATAL |
Table 7.1. Default settings for logging
The log levels are used as follows:
FATAL-
This level is used to report problems that may cause the engine not to work correctly.
ERROR-
This level is used to report problems that something has not worked as expected and may cause that the user gets an error message on the UI.
WARN-
This level is used to report problems that have to be solved because it can lead to errors later.
INFO-
This level is used to report that something was done. (E.g. for example a database call)
DEBUG-
This level is used to report internal events. Most of these events are only interessting for developers. However, some of them may also be interessting for troubleshooting.
Feel free to change the logging configuration to your needs.
A log message looks like the following:
10:19:14.173 INFO [ch.ivyteam.ivy.richdialog.exec.internal.panel.RichDialogPanelImpl] [http-8082-4] [application=0, client=127.0.0.1, task=4, pmv=System$Administration$1, session=4, request=Ulc over HTTP POST 115D746C75FAF428/start1.ivp, executionContext=SYSTEM]
  Can not restore UI state. No user is logged in.
The first entry of a log message is the exact time it was written
(10:19:14.173). Followed by the log level of the message
(INFO). Next is the log category
([ch.ivyteam.ivy.richdialog.exec.internal.panel.RichDialogPanelImpl]).
Then the name of the thread in whichs context the log message was written follows
([http-8082-4]). The next section conains a lot of Axon.ivy
context information. For example the user session or the process model version that
were active when the log message was written. The content of the context information
can change depending on the context the log message was written. The following
context information exists:
- application
-
The identifier of the current application.
- client
-
The IP address and maybe the host name of the current web client.
- executionContext
-
The security execution context that is used to check permissions. This can be the current session or SYSTEM if security is disabled.
- request
-
Information about the current request is written to the log.
- requestId
-
The identifier of the current request. Can be used to filter all messages that are written in the context of the same request.
- pmv
-
The identification string of the current process model version.
- processElement
-
The process element that is currently executed.
- rd
-
The fully qualified name of the current Rich Dialog.
- session
-
The current Axon.ivy session. The identifier of the session and the user name (if a user is logged in).
- task
-
The identifier of the current task.
On the next line the message that was logged follows. In case of errors a java exception stack trace may follow on the next lines.
On the Axon.ivy Designer certain events of processes are logged to the runtime log view. The process designer itself can write to the runtime log using the ivy.log object. On the Axon.ivy Engine all information written to the runtime log is handled by Log4j. It is written to the console, to log files and to the Windows Event Log.
The runtime log entries are written to special log categories which names start with runtimelog followed by the application name, the process model name, and the runtime log category. For example: the category name runtimelog.app.hrm.user_code represents the runtime log of the application called app, with the process model called hrm and the runtime log category user_code.
The following xml snip can be added to the Log4j configuration file so that the runtime log of the process model hrm of the application app is written to its own log file called runtimelog.app.hrm.log:
<!-- Defines a log file called runtimelog.app.hrm.log -->
<appender name="RuntimeLog" class="org.apache.log4j.DailyRollingFileAppender">
 	<param name="File" value="${user.dir}/logs/runtimelog.app.hrm.log"/>
 	<param name="DatePattern" value="'.'yyyy-MM-dd"/>
 	<layout class="org.apache.log4j.IvyLog4jLayout">
		<param name="DateFormat" value="HH:mm:ss"/>
 	</layout>
</appender>

<!-- Configures that the log category runtimelog.app.hrm has priority DEBUG and is written to the RuntimeLog file -->
<category name="runtimelog.app.hrm" class="ch.ivyteam.log.Logger">
  <appender-ref ref="RuntimeLog"/>
  <priority value="DEBUG"/>
</category>
If you want to know the time when a request was received from the Axon.ivy Engine and at what time the request processing of the engine was done, then you use the following log category:
ch.ivyteam.ivy.webserver.internal.PerformanceLogValve
Configuration Example (configuration/log4jconfig.xml):
<!-- Configures that the log category ch.ivyteam.ivy.webserver.internal.PerformanceLogValve has priority DEBUG  -->
<category name="ch.ivyteam.ivy.webserver.internal.PerformanceLogValve" class="ch.ivyteam.log.Logger">
  <priority value="DEBUG"/>
</category>
The log category logs the entry of a request right after the internal web server has received it. The exit is logged after the request was processed by the web server. In the exit log message you find the duration of the request in microseconds.
The log level of the these messages is DEBUG. Change the threshold of
the appenders to DEBUG so that log messages with this priority are written to the
appender's destination.
Configuration Example (configuration/log4jconfig.xml):
<appender name="FileLog" class="org.apache.log4j.DailyRollingFileAppender">
  <param name="Threshold" value="DEBUG"/>
  <param name="File" value="${user.dir}/logs/ch.ivyteam.ivy.log"/>
  <param name="DatePattern" value="'.'yyyy-MM-dd"/>
  <layout class="org.apache.log4j.IvyLog4jLayout">
    <param name="DateFormat" value="HH:mm:ss.SSS"/>
  </layout>
</appender>
If you want to know what the Axon.ivy Engine has done between the entry and exit
of the request you can use the context information requestId which you
can find on every log message. A unique request identifier is assigned to every
request. By filtering the log for messages with the same requestId you
find out what kind of operations Axon.ivy Engine has done during the request.
Example:
10:49:40.904 DEBUG [...rformanceLogValve] [http-8081-1] [requestId=43]
  Entry url=http://localhost:8081/ivy/pro/designer/OpenEditor/13224891E742EE17/start4.ivp client=0:0:0:0:0:0:0:1 session=null httpsession=C900A5BC35251533DEB5B36E4316EE98
10:49:41.020 INFO [...nEditor.user_code] [http-8081-1] [application=2147483647, client=0:0:0:0:0:0:0:1, requestId=43, task=1, pmv=designer$OpenEditor$1, processElement=13224891E742EE17-f26-t, session=1, request=HTTP GET test.mod/start4.ivp(1.1.0.0), executionContext=1]
  This is my log message
10:49:41.050 INFO [...ner.OpenEditor.db] [Process Extension Thread 1] [application=2147483647, client=0:0:0:0:0:0:0:1, requestId=43, task=1, pmv=designer$OpenEditor$1, processElement=13224891E742EE17-f29-bean, session=1, request=HTTP GET test.mod/start4.ivp(1.1.0.0), executionContext=SYSTEM]
  Execute database statement SELECT * FROM IWA_ACCESSCONTROL
10:49:41.050 INFO [...ner.OpenEditor.db] [Process Extension Thread 1] [application=2147483647, client=0:0:0:0:0:0:0:1, requestId=43, task=1, pmv=designer$OpenEditor$1, processElement=13224891E742EE17-f29-bean, session=1, request=HTTP GET test.mod/start4.ivp(1.1.0.0), executionContext=SYSTEM]
  Executed database statement successfully in 0 milli seconds
10:49:41.100 DEBUG [...rformanceLogValve] [http-8081-1] [requestId=43]
  Exit url=http://localhost:8081/ivy/pro/designer/OpenEditor/13224891E742EE17/start4.ivp client=0:0:0:0:0:0:0:1 session=1 httpsession=C900A5BC35251533DEB5B36E4316EE98 duration=194181 us
In the example above you see the log messages when the request with the id 43 has entered and exited the web server. There was also one user runtime log message written in the same request and one database call that has lasted 0 milliseconds. The whole request needed 19.418 ms to be processed.
It is possible to log ULC communication and status messages both on client and server side. Both a default log level and a log level per known Ivy user can be configured, as well as a log file path/name where the log of an ULC session should be stored permanently.
To configure ULC logging, the files configuration/jnlpconfig.any and configuration/ulclogconfig.any within the Axon.ivy Engine installation folder must be edited. The former one controls the client-side logging, the latter one the server-side logging. The log configurations are similar in both cases and edited with Anything notation.
To modify the client logging properties locate the following section in jnlpconfig.any:
...

/log-level  {
    /user-specific {
        /johndoe  FINER
    }
    /default  WARNING
    /log-to-file   "C:/temp/xpertivy_ulc_client.log"
}
...
To modify the server logging properties locate the following section in ulclogconfig.any:
{
    /user-specific {
        /johndoe  FINER
    }
    /default  WARNING
    /log-to-file  "xpertivy_ulc_server.log"
}
To enable user-specific logging on server side and/or client side, enter the known
name of the Ivy user (or AD user) to log for in the /user-specific
section, followed by a valid log level (one of SEVERE,
WARNING, INFO, FINE, FINER,
FINEST) just as specified in the example configurations with the
user johndoe. Use double quotes around the Ivy user name if it
contains special (i.e. non-ASCII) characters or white space.
To set the default log level (which will be used for all sessions) set the log
level for the key /default.
Finally, to enable logging to a file, enter a filename in
double quotes for the key /log-to-file as shown above.
If the /log-to-file slot is omitted altogether or if it's value is a
*, then no logfile will be created.
Note
Changes in log configurations take place immediately for all new sessions or client application starts; a restart of the engine is not necessary. However, you have to restart any running client applications for the new log settings to take effect.
The created log files will automatically include the user name (if user-specific logging is enabled), the HTTP session ID and an ID for the application. The two ID's mentioned are part of the client and the engine log file, so it is easy to find the two logs related to a client-server communication.
Tip
For reasonable results a default level of WARNING or
INFO is recommended. For error analysis, FINER on
the client and FINER on the server is recommended, on a per-user
basis.
If you enable ULC logging, it is recommended to specify the
/log-to-file parameter. This way the log output is redirected
to a file, otherwise the logs are written to the console.
Warning
Please bear in mind that the logfile path that you specify may not be in correct format for every client platform (Linux/Windows). If this should be the case then the logfiles will be created in the client system's default temporary directory.
Be aware that log files can become very large (up to several hundred MB per
day and user if FINE /FINER/FINEST is used as log
level).
On an Axon.ivy Engine it is possible to dump out performance statistic informations, periodically into a CSV formatted file. This allows to analyse the performance of the engine and to detect long running and performance intensive process elements and processes. The file contains detailed informations of each executed process element since the last dump.
After activation the informations are collected and written to the
log-directory of the Axon.ivy Engine installation. The file
contains the following name: performance_statistic_jjjj-mm-tt_hh-mm-tt.csv (e.g.
performance_statistic_2011-03-15_09-21-05.csv)
All configurations are administered by the following System Properties:
| Property | Description |
|---|---|
| ProcessEngine.FiringStatistic.Active |
A restart is not required after de-/activation. The setting
take effect, maximum after the duration of the defined interval
(System Property:
|
| ProcessEngine.FiringStatistic.Interval |
Interval in seconds the statistic is written to the log directory. Default value is 300 seconds (5 minute). After each interval the statistic informations are cleaned after the dump out. A restart is required after a value change. |
Table 7.2. System properties to configure the firing statistic
All time values are in milliseconds. The execution of some process elements are separated in two categories internal and external.
- Internal Category
-
The internal category is used for the execution time in the process engine itself without the external exection.
- External Category
-
The external category is used for execution time in external systems. In the table below the process elements are listed which use the external category.
Process Element Internal Category External Category Database Step Parameter-mapping, caching, output-mapping and ivyScript execution. The execution of the SQL statement on the database server. Web Service Call Step Parameter-mapping, caching, output-mapping and ivyScript execution. The execution of the Web Service on the web server. Email Step Parameter-mapping The interaction with the Mail-Server. Program Interface The execution of the defined Java-Class. Table 7.3. Process elements with usage of external category
For each executed process element one entry in the view is created. See the table below which information is available.
| Name | Description |
|---|---|
| Entry ID | Entry ID, useful to order the entries by its first exection. |
| Application | Application of the process element. |
| Process Model | Process Model of the process element. |
| PM Version | Process Model Version of the process element. |
| Process Path | The path to the process. |
| Element ID | The identifier of the process element. |
| Element Name | The first line of the process element name (display name). |
| Element Type | The type of the process element. |
| Total Time | Total time [ms] of internal and external execution. |
| Int. Executions | Total internal executions of the process element. |
| Total Int. Time | Total internal time [ms] of process engine executions. |
| Min. Int. Time | Minimum internal process engine execution time [ms]. |
| Avg. Int. Time | Avarage internal process engine execution time [ms]. |
| Max. Int. Time | Maximum internal process engine execution time [ms]. |
| Ext. Executions | Total external execution count. |
| Total Ext. Time | Total external execution time [ms]. |
| Min. Ext. Time | Minimum external execution time [ms]. |
| Avg. Ext. Time | Average external execution time [ms]. |
| Max. Ext. Time | Maximum external execution time [ms]. |
Table 7.4. Column Description
Tip
To find a process element by its Element ID, use the search dialog Find process or element in the Axon.ivy Designer. Use menu Axon.ivy > Debug > Find process or element.
Java Management Extensions (JMX) is a technology to read and write runtime information from a java processes. This allows monitoring tools to monitor the state the Axon.ivy Engine, e.g. with VisualVM, Java Mission Control or Nagios. A monitoring tool that runs on the same machine and with the same user as the Axon.ivy Engine can connect to Axon.ivy Engine without any additional configuration.
If the Axon.ivy Engine is running under another user or on a remote host than the monitoring tool, then JMX remote access has to be activated. Remote access is protected by a user name and password of an Axon.ivy Engine Administrator, so all Axon.ivy Engine Administrator have access.
On Windows uncommenting the following line in an ivy launch control file *.ilc (See chapter Windows Program Launcher Configuration) to activate remote access:
ivy.management.port=9003
On other operating systems the below options must be added to the launch configuration script of the engine (AxonIvyEngine.conf):
-Dcom.sun.management.jmxremote.port=9003
-Dcom.sun.management.jmxremote.login.config=jmx
-Djava.security.auth.login.config=configuration/jaas.config
-Dcom.sun.management.jmxremote.ssl=false
-Djava.rmi.server.hostname=<IP of the machine>
Some monitoring tools can auto discover running JMX servers in the network. If so the user does not have to know the server host and JMX IP port. Instead he can simple click on the auto discovered server.
Axon.ivy Engine supports auto discovery by default if JMX is activated on Windows. However, you can disable this feature by uncommenting the following line in the *.ilc file::
ivy.management.autodiscovery=false
On other operating systems the following option must be set to the launch configuration script of the engine (AxonIvyEngine.conf) to activate it:
-Dcom.sun.management.jmxremote.autodiscovery=true
The Axon.ivy Engine provides performance and management information by a set of MBeans. These allow to monitor the Axon.ivy Engine. Most monitoring tools provide a user interface to browse the available MBeans. MBeans are mostly shown in a tree which is built with the information provided in the names of MBeans.
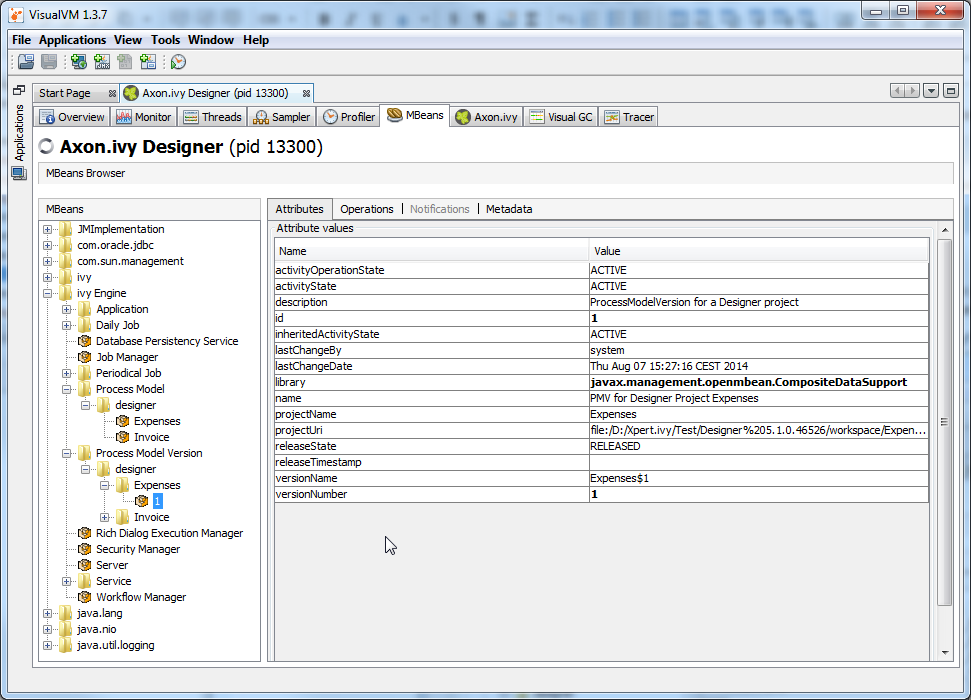
The names of MBeans provided by Axon.ivy are structured so that the name contains the Application, Process Model, Process Model Version or Environment where this is reasonable.
Note
Examples of typical Axon.ivy MBean names:
-
Axon.ivy Engine:type=External Web Service,application=MyApplication,environment=Default,name=Echo (43838347ABCD)
-
Axon.ivy Engine:type=Job Manager
-
Axon.ivy Engine:type=Process Start Event Bean,application=MyApplication,pm=MyProcessModel,pmv=1,name="MyStartEventBean (3485471349/start.ivp)"
The name and description of a MBean can be found in its meta information (see the Metadata tab in the MBeans tab of VisualVM). MBeans provide information through attributes and operations. The description of the attributes and operations can also be found in its meta information (see too the tool tips in the Attributes and Operations tab of the MBeans tab of VisualVM).
Warning
Manipulating attribute values or calling operations on MBeans will immediately change the configuration of your system and can therefore harm your running applications.
If not mentioned otherwise, a manipulation only affects the currently running engine. The manipulation will not survive a engine restart.
Manipulations that survive a engine restart contain the following text in the
description of the attribute or operation: (Persistent).
In addition to the MBeans provided by Axon.ivy some third party libraries included in Axon.ivy provide their own MBeans. One of them is Apache Tomcat that is used as internal web server. Its MBeans provide information about the handling of HTTP requests like request count, errors, execution time, sessions, etc. Moreover, the Java virtual machine also provides some MBeans that provide information about the used memory (Java heap), CPU usage, uptime, etc.
Below a not complete list of provided information:
-
External Database (connections, transactions, errors, execution time, etc.)
ivy Engine:type=External Database,application=*,environment=*,name=*
-
Web Service (calls, errors, execution time, etc.)
ivy Engine:type=External Web Service,application=*,environment=*,name=*
-
REST Web Service (calls, errors, execution time, slow calls, etc.)
ivy Engine:type=External REST Web Service,application=*,environment=*,name=*
-
System Database (connections, transactions, errors, execution time, etc.)
ivy Engine:type=Database Persistency Service
-
HTTP Requests (count, errors, execution time, etc.)
*:type=GlobalRequestProcessor,name=*
-
Number of Sessions (HTTP sessions, Axon.ivy sessions, licence relevant sessions, Rich Dialog client sessions, etc.)
ivy Engine:type=Security Manager
ivy Engine:type=Rich Dialog Execution Manager
*:type=Manager,context=*,host=*
-
Background jobs (name, next execution time, etc.)
ivy Engine:type=Job Manager
ivy Engine:type=Daily Job,name=*
ivy Engine:type=Periodical Job,name=*
-
Process Start Event Beans (polls, executions, errors, execution time, etc.)
ivy Engine:type=Process Start Event Bean,,application=*,pm=*,pmv=*,name=*
-
Process Intermediate Event Beans (polls, firings, errors, execution time, etc.)
ivy Engine:type=Process Intermediate Event Bean,application=*,pm=*,pmv=*,name=*
-
Application, Process Model and Process Model Version, Library information (activity state, release state, name, description, etc.)
ivy Engine:type=Application,name=*
ivy Engine:type=Process Model,application=*,name=*
ivy Engine:type=Process Model Version,application=*,pm=*,name=*
-
Cluster, Cluster Nodes and Cluster Communication information (received and sent message, errors, execution time, etc.)
ivy Engine:type=Cluster Manager
ivy Engine:type=Cluster Channel
-
Thread Pool information (core, maximum and current pool size, active threads, queue size)
ivy Engine:type=Thread Pool, name=Background Operation Executor
ivy Engine:type=Thread Pool, name=Immediate Job Executor
ivy Engine:type=Thread Pool, name=Scheduled Job Executor
-
System Database and CMS Cache
ivy Engine type=CacheClassPersistencyService,name=* [clearCache()]
ivy Engine type=CacheClassPersistencyService,name=*,strategy=CacheAll [maxBytesToCache, maxCharactersToCache]
ivy Engine type=CacheClassPersistencyService,name=*,strategy=CacheAllRemoveUnused [maxBytesToCache, maxCharactersToCache, countLimit, usageLimit]
ivy Engine type=CacheClassPersistencyService,name=*,cache=LongBinaries [readHits, readMisses, writes, cachedLongValues, clearCache()]
ivy Engine type=CacheClassPersistencyService,name=*,cache=LongCharacters [readHits, readMisses, writes, cachedLongValues, clearCache()]
ivy Engine type=CacheClassPersistencyService,name=*,cache=ObjectsAndAssociations [objectReadHits, objectReadMisses, objectWrites, cachedObjects, associationReadHits, associationReadMisses, associationWrites, cachedAssociations, clearCache()]
-
Memory (Java Heap, Perm Gen)
java.lang:type=Memory
-
CPU Usage, Uptime
java.lang:type=Runtime
java.lang.type=OperatingSystem
We recommend to use VisualVM to monitor Axon.ivy Engine processes. VisualVM allows you to monitor the memory and CPU usage of the Axon.ivy Engine process. It can be used to analyze problems in your Axon.ivy projects like memory leaks or thread dead locks.
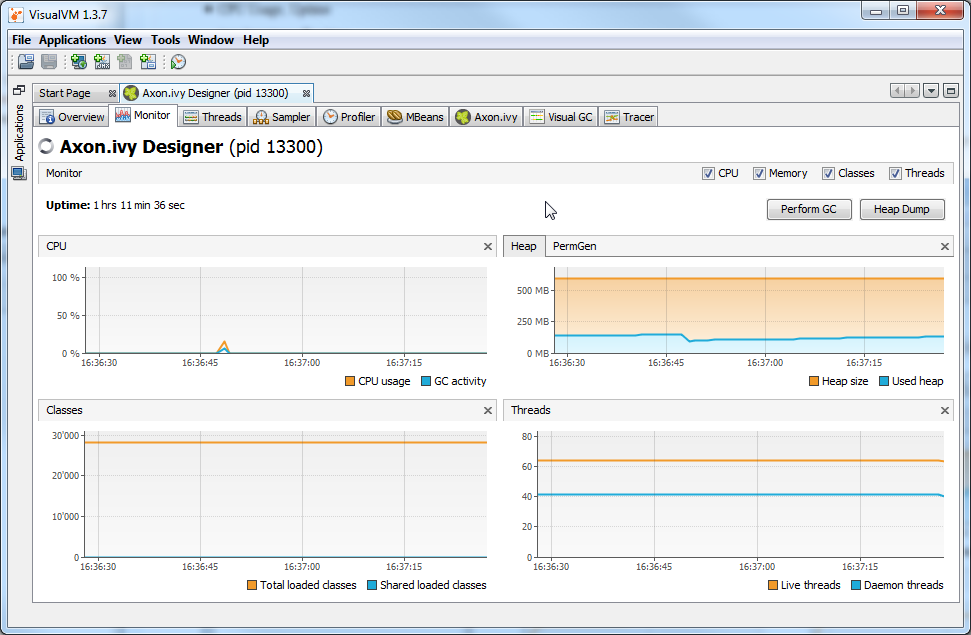
VisualVM can connect to all Java processes running on the same host and with the same user. In addition you can use JMX (See section Java Management Extension for more information) to connect VisualVM to processes that run with another user (e.g. as Windows Service) or on remote machines.
VisualVM is available from https://visualvm.github.io/ or as
jvisualvm in the bin directory of a JDK (Java
Developer Kit).
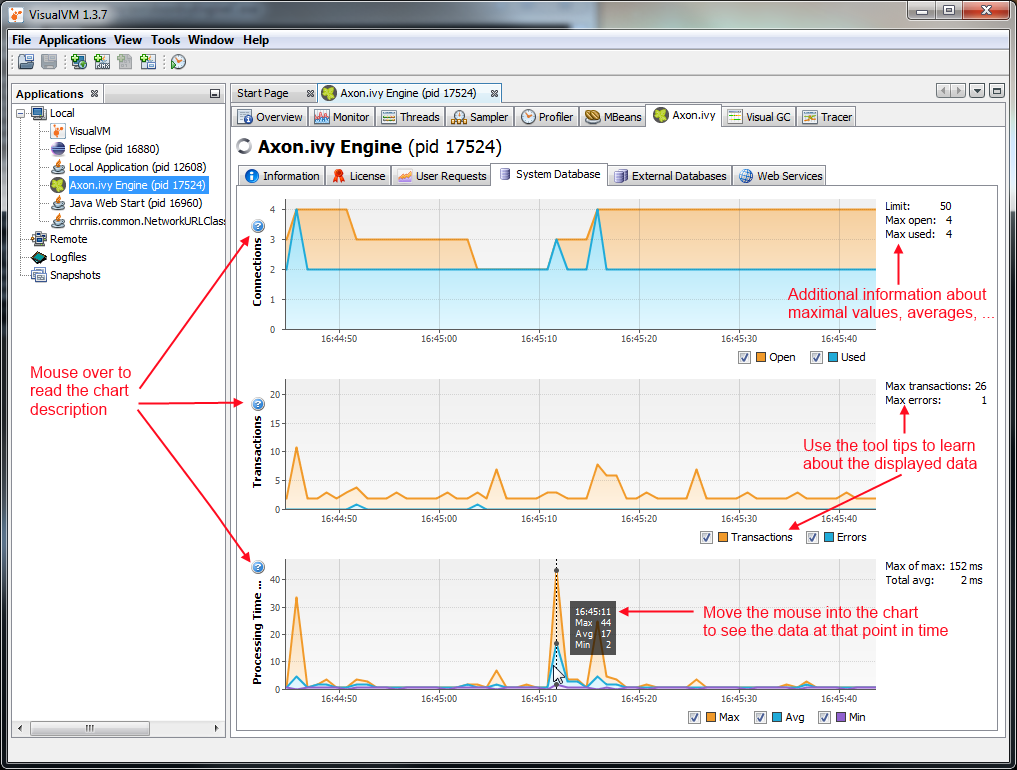
In the delivery of Axon.ivy we provide a dedicated plugin for VisualVM that allows you to monitor some of the technical aspects of an Axon.ivy Engine or Designer. For example you can observe the current transactions on the System Database, whether you violate the licence or how many requests are running at an Axon.ivy Engine at any given time. And in the same tool you can still observe the heap or CPU usage or create thread dumps.
Note
VisualVM is a tool to observe the current state of the monitored engine. It is not intended for long-time observation, recording or even alarming. If you want to do that, make use of the JMX extensions of Axon.ivy. in combination with tools like Nagios or IBM Tivoli.
The plugin itself should be mostly self explanatory. It consists of multiple tabs for the different aspects. Most of the tabs contain a number of charts that always have a similar structure:
-
Make sure that you have an installation of VisualVM. If you use a standalone version of VisualVM, please make sure that you use at least version 1.3.7.
-
Run VisualVM (in JDK go to the bin folder and start jvisualvm)
-
Go to the Tools/Plugins menu
-
Change to Downloaded tab and click on the Add Plugins... button
-
In the file chooser that appears, navigate to the subfolder misc/visualvm in your engine installation directory and choose the visualvm-plugin.nbm.
-
Follow the instructions in the installation wizard.
-
Choose the option to restart VisualVM at the end of the installation wizard.
In the Engine Administration application you can use the Runtime Information page to view information about the java heap memory and all running java threads with their current call stack. Another important page is the About page where you find information about the Axon.ivy Engine version, Java version and the Java system properties.
For each external database you can find information about the last SQL statements that have been executed on the database and the open connections to the database.